Willie Liebenberg - Farmer, SA

"The big problem I have faced is that after 4-5 years I go back to the office and all my year books are very busy, complicated or information may have been thrown away. That is why I really like using fieldmargin - being able to keep everything together and separated by year is really important."

Willie Liebenberg - Farmer, SA


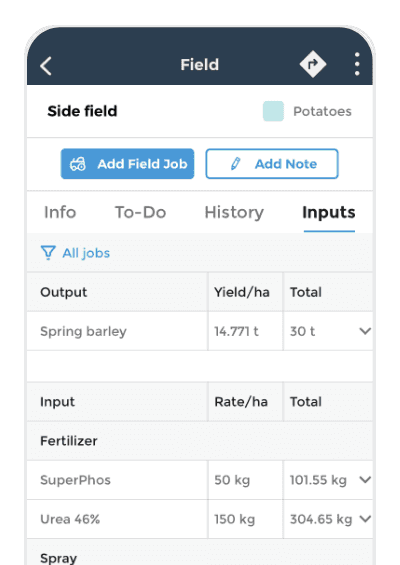
Screenshot of inputs on a mobile device in fieldmargin

Track input use per field and cross-farm

Monitor input use by field to check you are within legal limits, easily check which jobs an input was used on, know the amount of product required for the season for streamlined ordering, review what you applied to your fields by year for costings. Automatically records who completed the job and when as you tick them off.

Screenshot of field history on a mobile device in fieldmargin

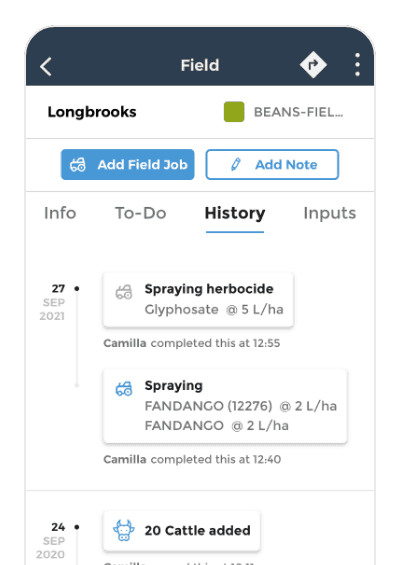
A history of each of your fields

Easily look back through the work done on your fields to see what was done when

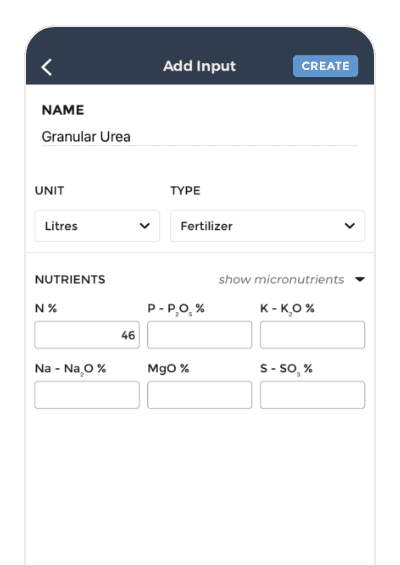
Screenshot of an input with nutrients being created on the fieldmargin mobile app

Nutrient management

Set the nutrient content of the fertilizers that you are using on your farm so that you can track applied quantities of NPK and other micronutrients. Caculate product required using target quantity of nutrients to be applied. Record the quantities of nutrients to be applied per job.

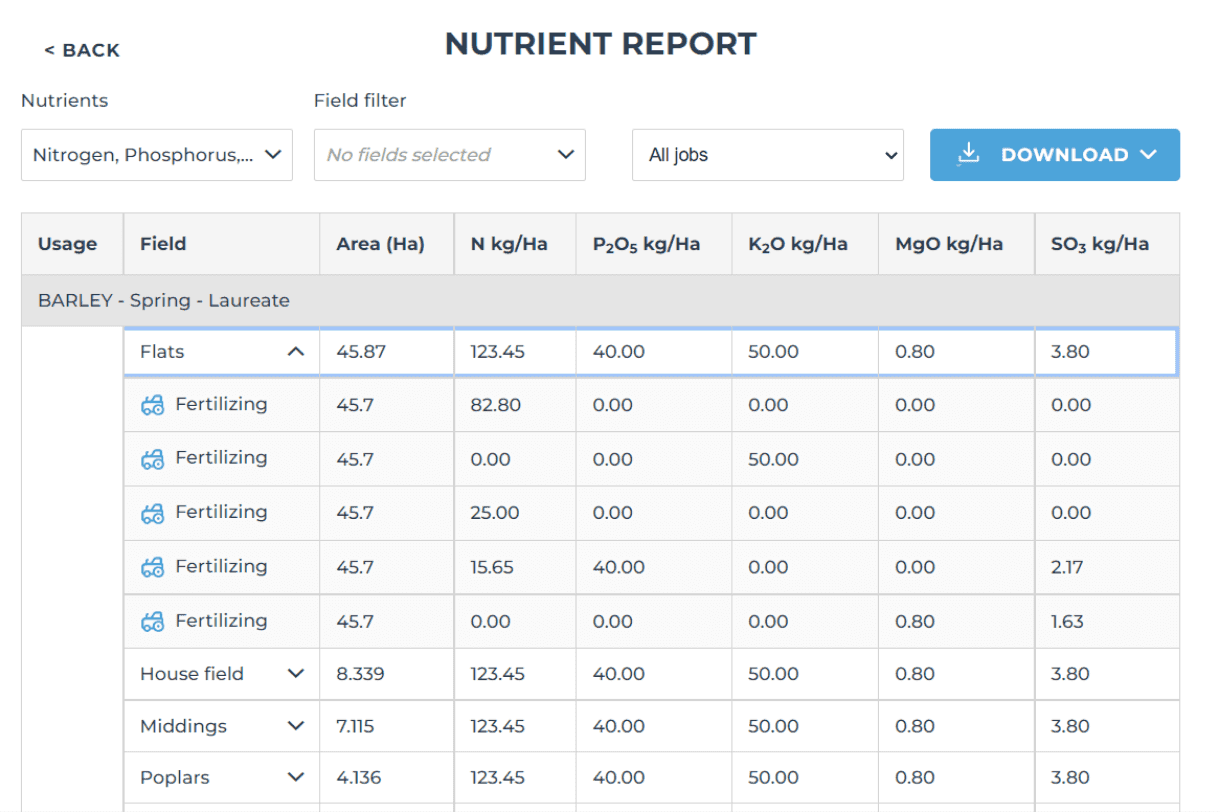
Screenshot of nutrient reporting in the fieldmargin web app

Nutrient report

Use the Nutrient Report to track nutrients such as Nitrogen, Phosphorus and Potash applied per field. You can filter the report to change which nutrients are displayed or to only show particular fields. Quickly switch between all or only planned work to see where you are against application limits.

Costings

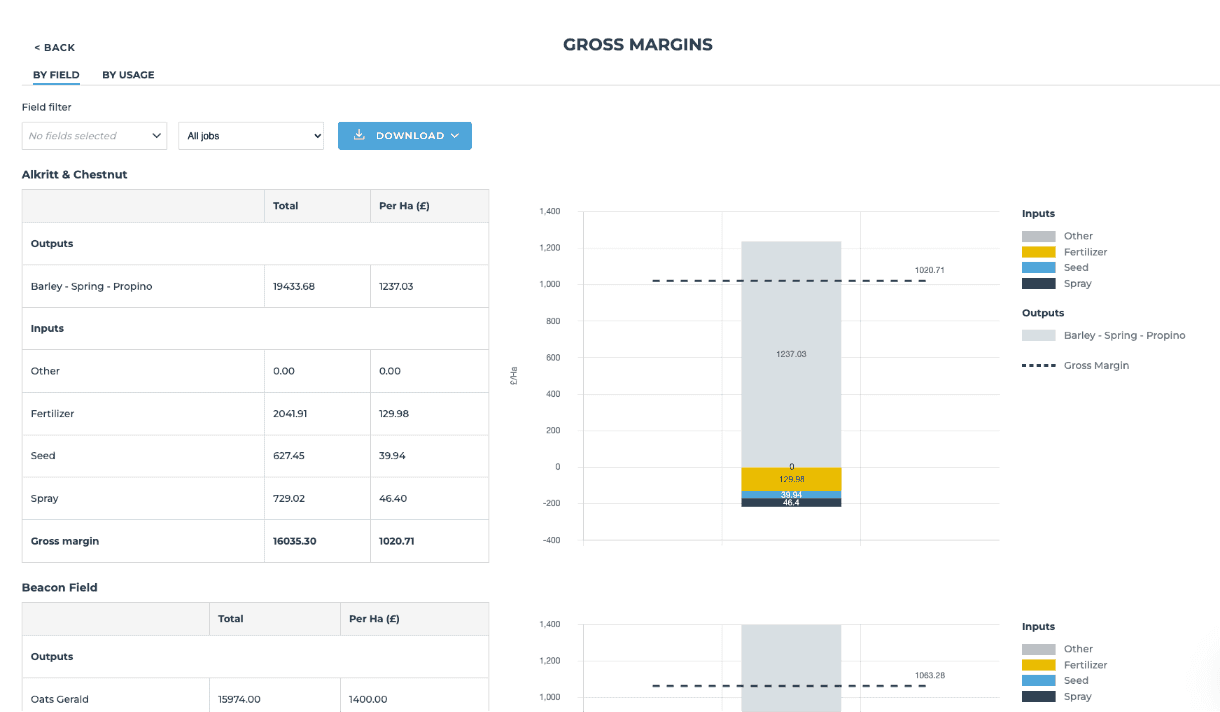
Keep a handle on your costs of production with reports for spend per input, per field and even gross margins. Just enter your input costs and output sale prices and fieldmargin does the rest using the information you record for field jobs. Compare spend by input type per field and margins per crop to identify areas for improvement.

Screenshot of gross margin report in the fieldmargin web app
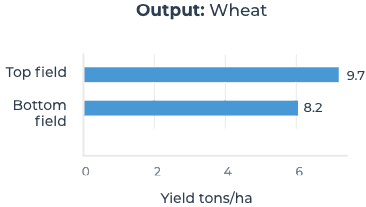
A horizontal bar chart showing yields in tons per hectare for two fields

Record and compare yields

Record harvest yield with yield/ha and total per field, automatically calculate farm total yield, visualise yield data with graphs to help compare performance by field, record yield data over the years.

Download your reports

Generate a spreadsheet of your reports for:

  • Paper copies for inspections
  • Costings analysis
  • Gross margin calculation
  • Farm benchmarking
Learn more
Graphic showing bar charts and magnifying glasses focussing on different bars

Works with:

  • John Deere Operations Center
  • Rural Payments Agency
  • Natural England
  • Drone Deploy

Used by our farmers for records:

  • Red Tractor
  • Global G.A.P
  • Soil Association
  • OF & G Organic